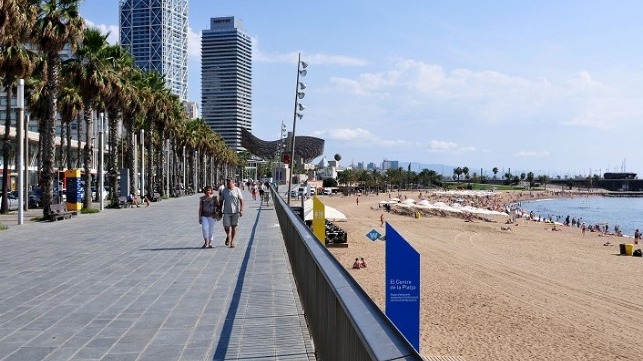
 Barcelona
_x000D_
By MarEx 2019-06-10 01:45:13
_x000D_
_x000D_
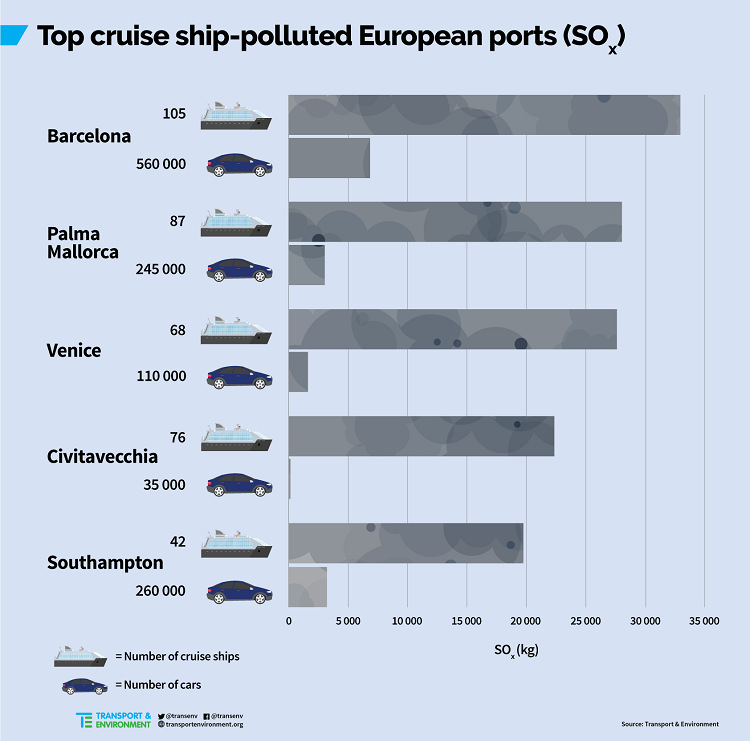
A new analysis by sustainable transport group Transport & Environment asserts that Carnival Corporation ships emitted nearly 10 times more SOx around European coasts than did all 260 million European cars in 2017.
_x000D_
_x000D_
Royal Caribbean is estimated to have emitted four times more than the European car fleet.
_x000D_
_x000D_
In absolute terms, Spain, Italy and Greece, closely followed by France and Norway, are the European countries most exposed to SOx air pollution from cruise ships, says Transport & Environment. Barcelona, Palma de Mallorca and Venice are the most impacted European port cities, followed by Civitavecchia (Rome) and Southampton.
_x000D_
_x000D_
NOx emissions from cruise ships in Europe was comparable to 15 percent of the NOx emitted by Europe’s passenger car fleet in a year, the report finds. In Marseille, for example, 57 cruise ships emitted almost as much NOx as one-quarter of the city’s 340,000 passenger cars in 2017. Along the coasts of countries such as Norway, Denmark, Greece, Croatia and Malta, a handful of cruise ships are responsible for more NOx than the majority of the domestic car fleet.
_x000D_
_x000D_
Europe should implement a zero-emission port standard, says the report, which also recommends extending emission control areas, currently in place only in the North and Baltic Seas and English Channel, to the rest of the European seas. Furthermore, the report recommends regulating NOx emissions from existing ships, which are currently exempt from NOx standards applying in emission control areas.
_x000D_
_x000D_
_x000D_
_x000D_
Methodology
_x000D_
_x000D_
The study analyzed 203 cruise ships that sailed according to ship automated identification system (AIS) in the EEZ of European countries in 2017. Operational data (including ship coordinates and speed) was obtained from ExactEarth. The AIS data for the analyzed ships had a nominal 1-hour interval between each data point.
_x000D_
_x000D_
The authors first allocated each data point to the EEZ and port cities and then used the methodology
followed by the IMO’s third GHG Study, previous T&E reports and the ICCT GHG inventory to estimate the fuel consumption of each ship and associated emissions of air pollutants for each data point and summed them for respective country EEZs and ports. In estimating emissions, the authors assumed that all the ships analyzed complied with the relevant fuel sulfur standards in place in each geographical area.
_x000D_
_x000D_
The report is available here.
_x000D_
source: www.maritime-executive.com
 GMC Assistant